The definition of ‘Moving Average’ refers the average value of a security’s price over a given period of time. There are several uses for moving average for people in the trading industry. They are useful to
(i) to measure the momentum of price
(ii) to ascertain the direction of the current and future price of security
(iii) to define sections of possible supports and resistances
(iv) to give importance on the direction of a trend and
(v) to reduce the ‘noise’ of price and volume which otherwise may create confusion while analyzing.
It is simply the average price of a security at a given period of time. Usually, these are calculated using closing prices. The sum of closing prices for the last ten days divided by ten is the Moving Average of that security. Naturally, as its name implies, the moving average moves or changes with the price movement.
Let us now study an example of a ten day simple Moving Average calculation:
Assume the Closing prices of a security as: 1, 2, 3, 4, 5, 6, 7, 8, 9, 10, 11, 12, 13, 14, 15. Now,1st value of 10 day SMA (Simple Moving Average) will be:
1+2+3+4+5+6+7+8+9+10=55/10=5.5
2nd value of 10 day SMA (Simple Moving Average) will be:
2+3+4+5+6+7+8+9+10+11=65/10=6.5
3rd value of 10 day SMA (Simple Moving Average) will be:
3+4+5+6+7+8+9+10+11+12=75/10=7.5
4th value of 10 day SMA (Simple Moving Average) will be:
4+5+6+7+8+9+10+11+12+13=85/10=8.5
5th value of 10 day SMA (Simple Moving Average) will be:
5+6+7+8+9+10+11+12+13+14=95/10=9.5
Though different chartists have different explanations about moving average, everybody agrees on one point. It is about the point of moving average slope. In case the slope is up, then the trend will be up. Traders can expect upward price movement and vice versa.
This moving average focuses more on the recent price movement and hence it is considered as more responsive towards than a simple moving average. The calculation for this is not as simple as the calculation for simple moving average [SMA]. It is complicated. Charting Software applications provide the calculation of EMA and hence traders can easily concentrate on other implications rather than on the calculations. EMA turns faster and has less lag than SMA.
This provides more importance on the most recent data than EMA. The weight or the importance is calculated with the sum of days.
Example: For a 5-day weighted moving average the Sum of Days is 1+2+3+4+5 = 15
The weighting is shown below:
Day | 1 | 2 | 3 | 4 | 5 |
Price (Rs.) | 16 | 17 | 17 | 10 | 17 |
Weighting | 1/15 | 2/15 | 3/15 | 4/15 | 5/15 |
Weighted value | 1.07 | 2.27 | 3.40 | 2.67 | 5.67 |
5 Day WMA | 15.07 |
Calculation of weighted values are done by multiplying the price of current day by 5/15, yesterday by 4/15, day before yesterday by 3/15 and so on. The final WMA is the sum of the all 5 weighted values.
Display 1: This is a simple trading strategy. When WMA>EMA and EMA>SMA then the trend is clearly up and if WMA To find out the short, medium and long term trend, moving averages of different time periods are helpful.
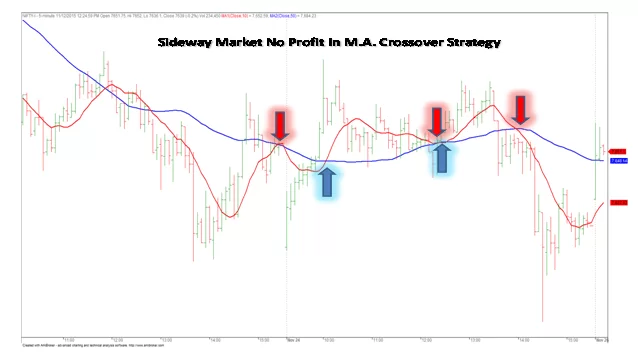
When used in trending market, these moving averages provide lots of trading opportunities, which are also profitable. When short term MA crosses long term MA and goes above the longer term MA, then the trader must take the buyers position. Likewise, when the short term MA crosses long term MA and goes below long term MA, then the trader must take the sell position.
The ratio between these two terms, short and long, must be from 1:4 to 1:5. For example, if 10 SMA are considered as MA, then the long term MA will be 40 SMA or 50 SMA. This type of MA cross over technique is good and is suitable only in trending markets. During non-trending market, implementing this technique is risky because this may trigger many false signals.
Start Your Education Here: Best Share Market Course
Start Your Education Here: Technical Analysis Training Course