
- Navigating the stock market will require more than just capital.
- It will also require or demand an understanding of stock market signals.
- The main goal is to equip both novice and experienced traders with the tools they need to decode market signals, paving the way for informed investment decisions.
Understanding the basics of stock market signals
- The stock market signals are the indicators and patterns that provide insight into the future movements of the market.
- These signals can be derived from various sources, which will include price movements, trading volumes, economic indicators, and global events.
- One of the most fundamental aspects of decoding the stock market trend is to recognize that it is influenced by a huge mix of both quantitative data and market sentiment.
Technical analysis: The backbone of deciphering the stock market signals
- Technical analysis is at the forefront of understanding stock market signals.
- This method will involve analyzing the historical market data, primarily the price and volume, so as to forecast future market behavior.
- By studying the charts and using the indicators such as moving averages, Bollinger bands, and the relative strength index (RSI), investors will be able to identify the patterns as well as trends that will also signal potential market movements.
Fundamental analysis: Complementing technical insights
- While technical analysis is very crucial in decoding stock market signals, it is often complemented with the help of fundamental analysis.
- The approach will involve examining the financial statements of the company, market share, competition, and overall economic condition.
- A deep dive into these aspects can also reveal stock market signals.
- This will concern the long-term viability and performance potential of the company.
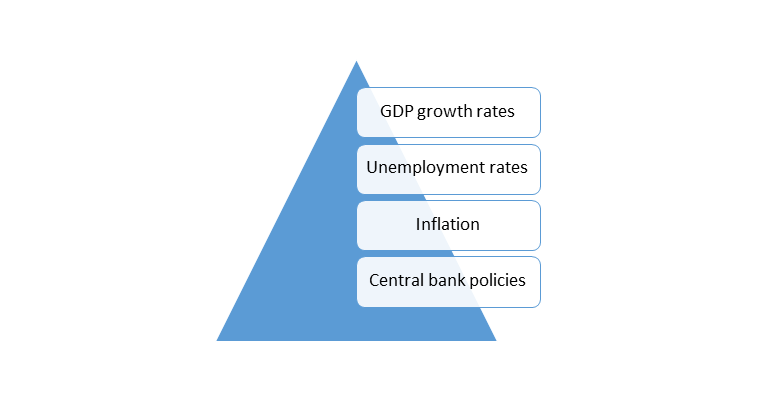
Economic indicators: macro-level stock market signals
-
Economic indicators are the most vital stock market signals that will reflect the overall health of the economy.
This will include the following metrics:
- Understanding how these indicators will affect the stock market can also provide the most valuable insight into potential market movements.
Market sentiment: The psychological aspect of the stock market signals:
- Market sentiment is also the most critical component of stock market signals.
- It refers to the overall attitude of the investors towards the market or specific securities.
- Sentiment is influenced by news, rumors, and global events.
- Decoding this aspect of stock market signals will also require an understanding of investor psychology and behavioral finance.
Risk management: Interpreting stock market signals safely
- Risk management is also considered to be one of the most crucial aspects of decoding market signals.
- The stock market is inherently volatile, and at times even the most promising signals can lead to losses.
- Strategies such as setting stop-loss limits, diversifying portfolios, and avoiding over-leveraging are essential in managing the risks while following the stock market signals.
Algorithmic trading: Modern tools for decoding stock market signals
- In this age of technology, algorithmic trading has become a key method to decode stock market signals.
- These are the computer signals that will be able to analyze the vast amount of market data at high speeds and also identify potential trading opportunities based on predefined criteria.
- However, if algorithms are powerful, they will still lack human insight.
- This is very much necessary for the context, thereby making this combined approach more effective.
Continuous education: Keeping up with the stock market signals
- The entire landscape of the stock market is continuously evolving, which means that stock market signals can also change over time.
- Investors are supposed to stay educated and adapt to new techniques and information.
- This will involve keeping abreast of global economic news, regulatory changes, and the advancements in trading technology.
Conclusion
Decoding stock market signals is an art and science that blends technical and fundamental analysis with an understanding of market sentiment and economic indicators.
Frequently Asked Questions (FAQs)
Q1) How do you predict a bull market?
A new bull will begin once the price rises at least 20% off the most recent market bottom.
Q2) What is the best indicator of the bull market?
RSI weakness is the best indicator of the bull market.
Q3) What will signal the start of the bull market?
The bull market will start when the economy is strengthening or is already strong.
Q4) What is the most accurate indicator?
The most accurate indicator is the Moving Average Convergence Divergence (MACD).
Q5) Which indicator shows both bullish and bearish?
The Relative Strength Index (RSI) shows both bullish and bearish trends.
About Us
Nifty Trading Academy is our academy, where we teach you about the stock market as well as technical analysis. We also provide live trade sessions and upload blogs for them.