Investing in stock market is not everyone’s cup of tea. In fact, the selection of the right stock is very important to make good returns. Furthermore, one wrong investment can lead to the erosion of capital. Therefore, it is very important to understand and know the details of a company before investing in it. To help the investor, Screener.in provides the right analysis of stocks.
What is Screener?
Screener is a stock analysis tool. It gives information to the investor about various details of the listed companies on the Indian Stock Exchange. In fact, the Website uses modern technology to research stocks.
How Screener.in Website Helps Investors?
Quick Information About Company
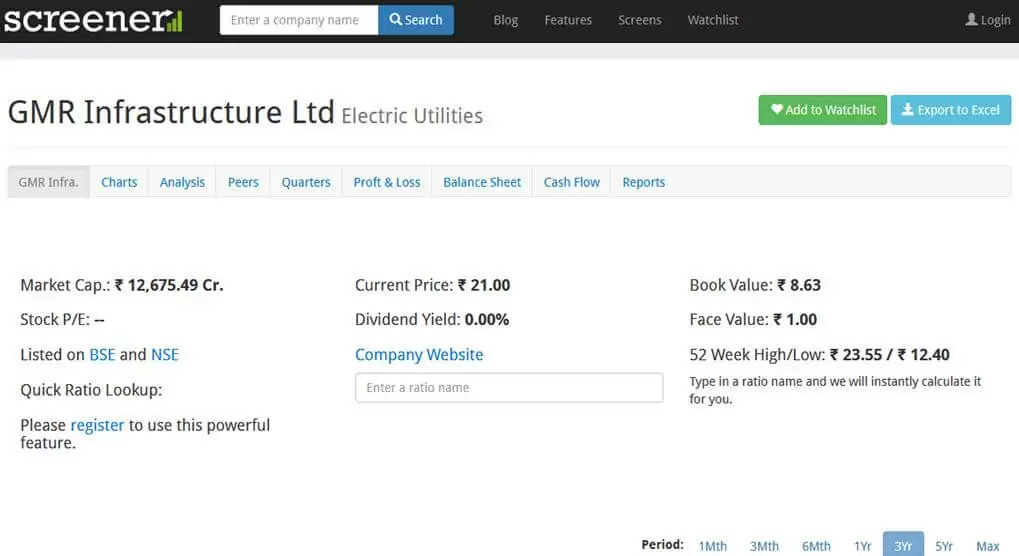
Screener.in provides quick information about the company. When the user puts the name of the company in the search bar and selects it, the page takes the user to the stock page. Furthermore, on the page the basic details about the company are available. The details include the sector in which the company is working, market capitalization, stock P/E, book value, and much more. Therefore, by looking at the details available, the investor can get an idea about the company before further research. For example, look at the page of the basic details of GMR Infra.
Flexibility to Look at the Ratios
Screener.in provides the feature to calculate the different ratios. The user just needs to log in and use the feature. In fact, the user can calculate any ratio like sales ratio, profit ratio, return on equity ratio, etc. for the study purpose at a single click. Therefore, complex ratios can be evaluated in few seconds as per the requirements. Moreover, the calculation of the ratio is done using the data of past 10, 5 and 3 years to give the right picture of the company’s performance. For example, the user can log in to the website and use the feature to calculate different ratios.
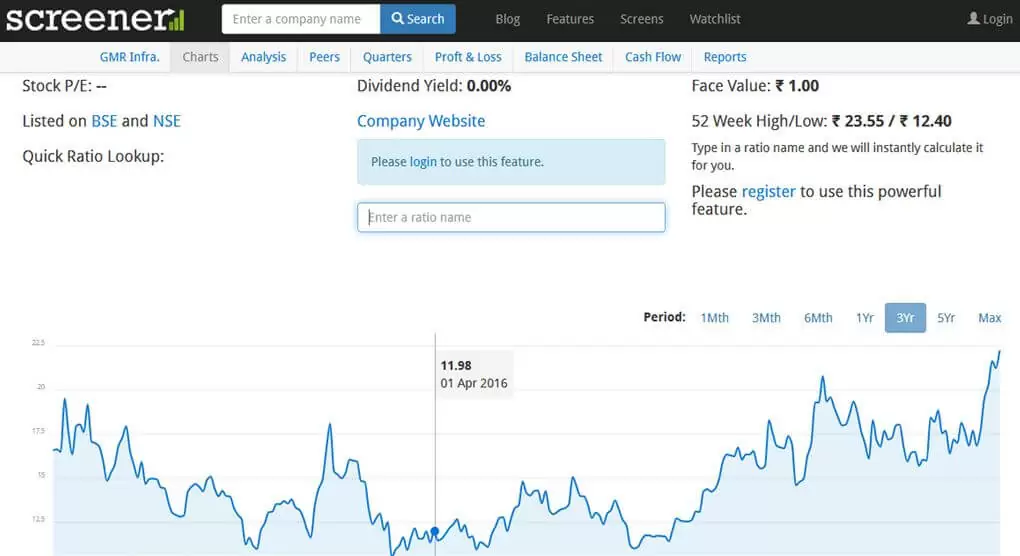
Chart Analysis
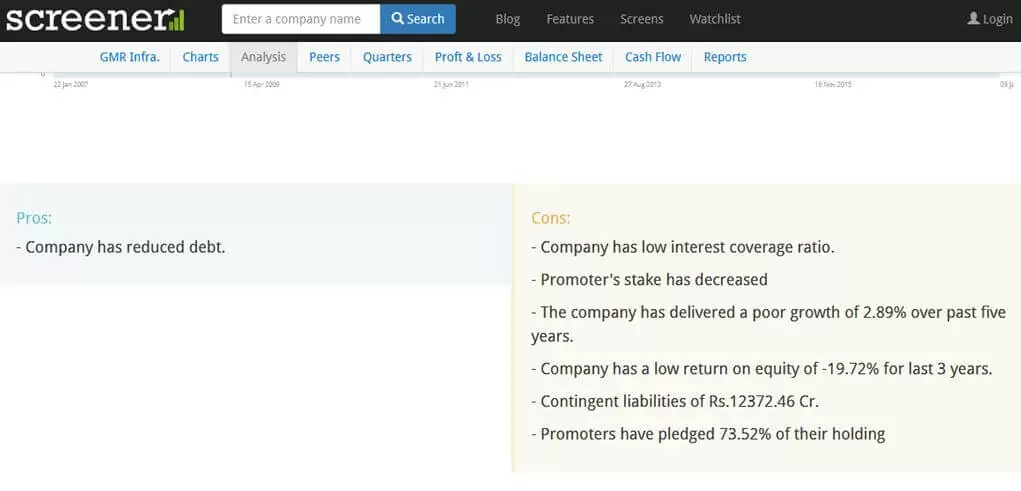
Charts hold a significant role in the analysis of the stock. In fact, the charts tell the stock movement from highs and lows for various years. Furthermore, the charts on screener.in are available for a period of more than 5 years. Therefore, the chart analyst can understand the stock pattern and take an investment decision. For example, have a look at the chart of GMR Infra available on the website.
Pros and Cons
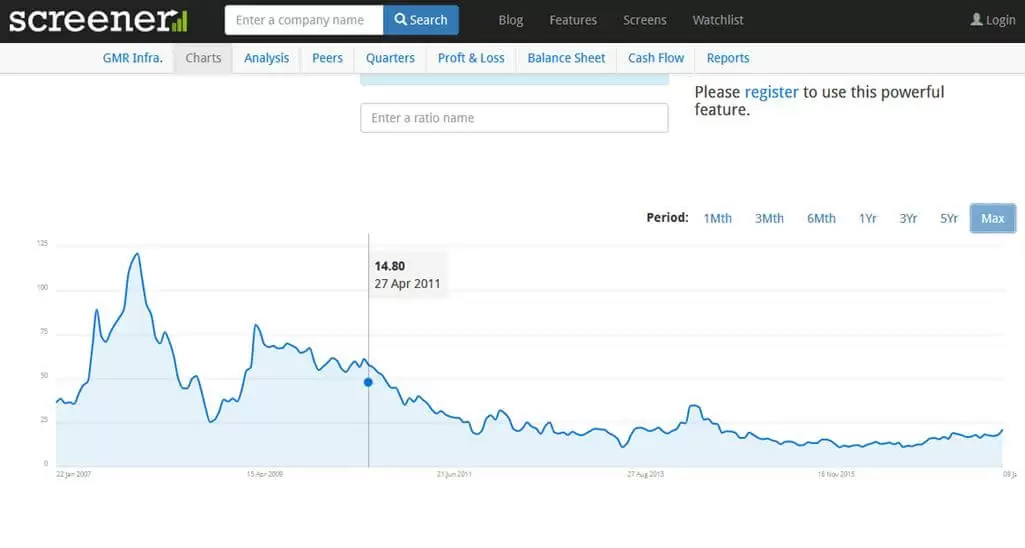
Screener.in provides an interesting feature of pros and cons of the stock. To put it another way, the website provides the good and the bad points of a company. The pros and cons of a stock are on the basis of recent news flows and analysis of the financial statement. Therefore, the investor is able to know the risks and advantages of a stock at a glance. For example, the pros and cons of GMR Infra can be seen in the image below.
Peer Comparison
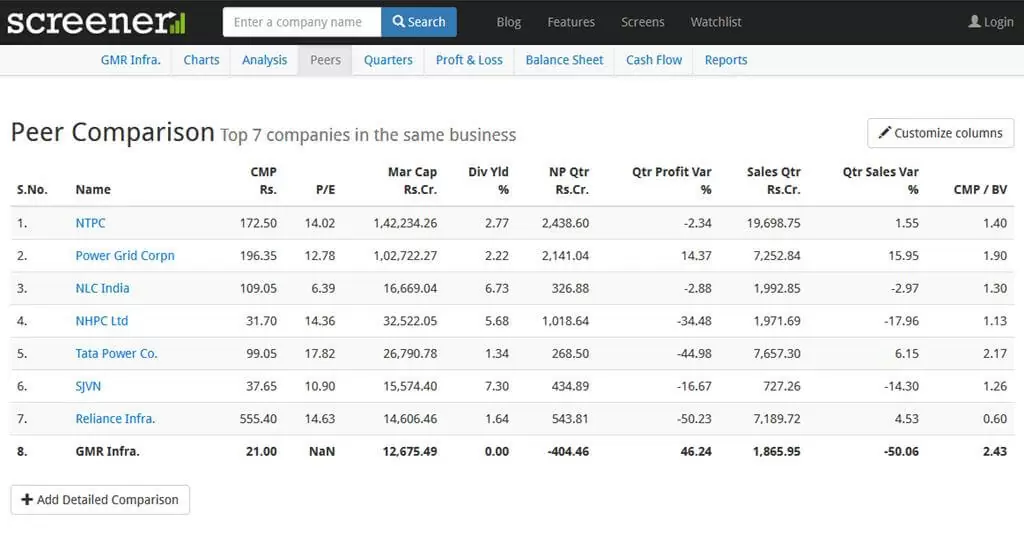
Comparison of peer companies is very important to determine the right valuation of a company. To put it another way, peer comparison means comparing a company with another company into a similar business. In fact, it helps in determining whether the company is right for investment. This website presents the data of peer companies for comparison. The data includes current market price, P/E, market capitalisation, dividend yield percentage, sales, profits, and many more details. Therefore, by looking at the multiple data fields, comparison and the right selection of companies can be done easily. For example, let us have a look at the peer comparison of GMR Infra.
Quarterly Results
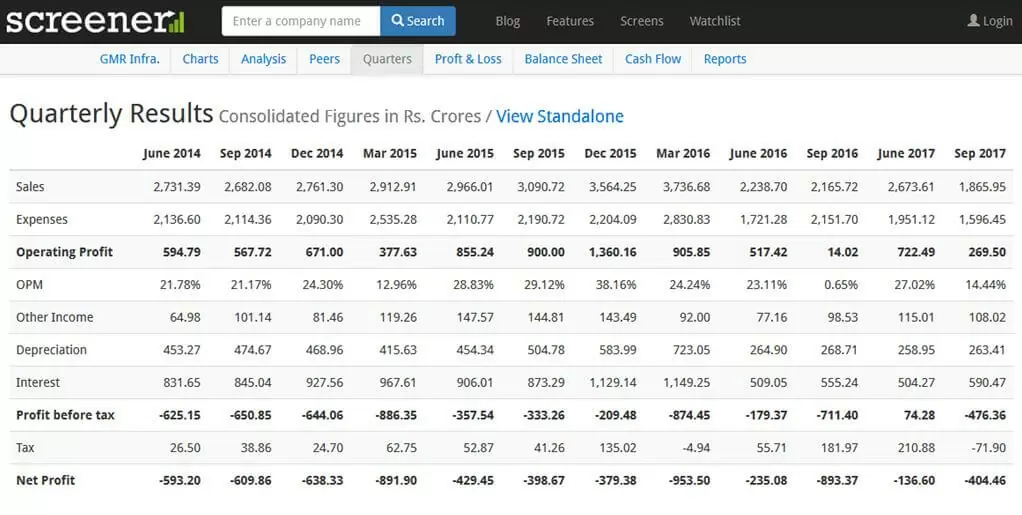
While investing in a particular stock the investor must know the quarterly results. In fact, the quarterly results provide the base for the study and analysis of a company. Moreover, analysis of any company is not possible with the quarterly numbers. So for that reason screener.in provides quarterly results of the company. In fact, results for the last 12 quarters can be seen on a single screen. Therefore, the feature of results of many quarters at a single place is of great help while analysing a stock for investment purposes. To illustrate, let us have a view of GMR Infra quarterly results page view on the website.
Annual Results
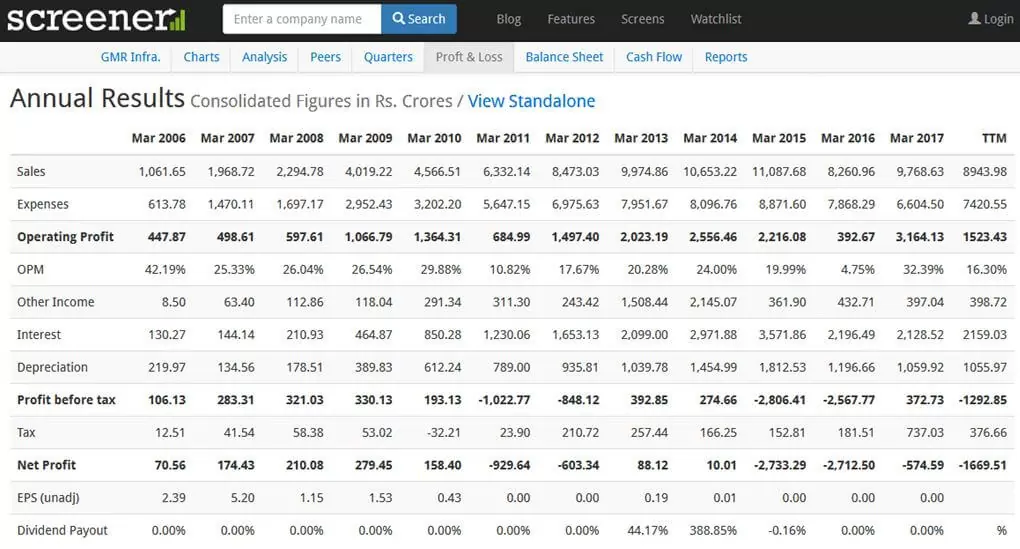
The annual results of the company must be read thoroughly before investing in it. Screener.in provides every detail of annual result that can help in the analysis of a stock. In fact, the website gives annual results of the company for the last 12 years. Therefore, one can easily evaluate the performance and consistency of delivering profits through the annual report. To illustrate, let us have a look at the annual results of GMR Infra for the last 12 years available on website.
Balance Sheet Review
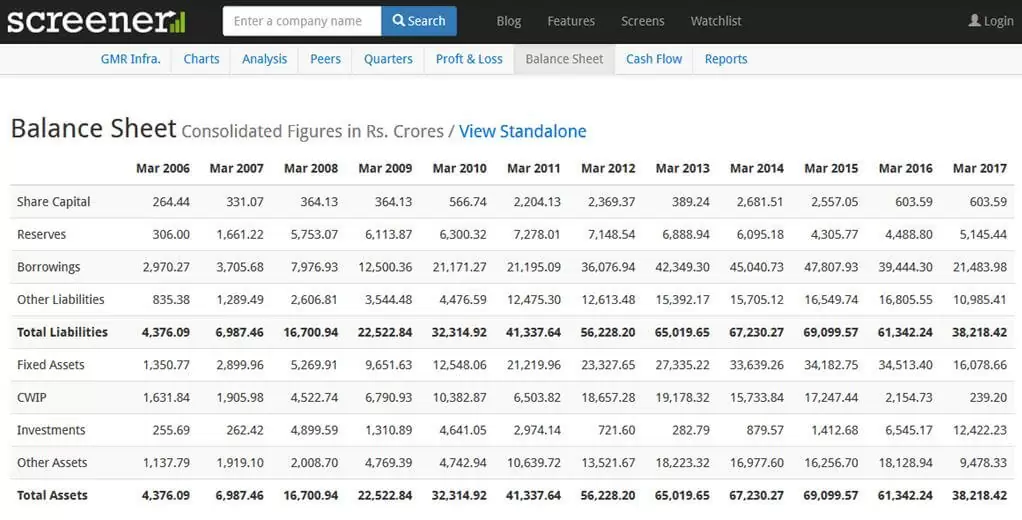
Reviewing the balance sheet of a company is the basic thing to do while analysing a stock for investment. This website provides the balance sheet of a company for the last 12 years. In addition, the investor can compare the performance of all the past years and arrive at conclusion about investing in the stock. For example, let us have a look at how screener.in provides the balance sheet for last 12 years of GMR Infra.
Analysis of Cash Flow Statement
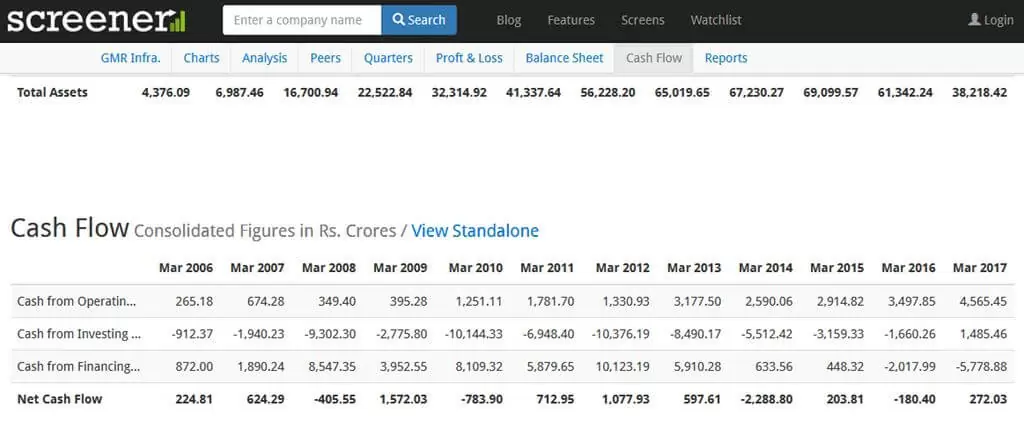
Screener.in help in the analysis of cash flow statement. A cash flow statement forms a significant part of financial statements. The investor can go through the cash flow statement of the past 12 years and understand the company’s performance. For example, let us have a view of the cash flow statement of last 12 years of GMR Infra on the website.
Latest News and Information
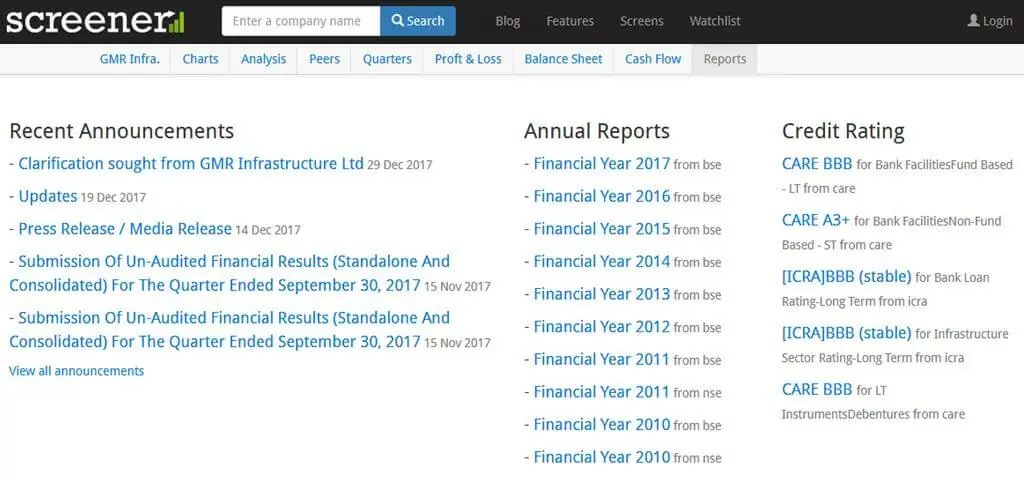
It provides the latest news and information about the company. The latest news comprises of recent announcements made by the company. In fact, the news often helps in determining whether investment should be made in the stock or not. Moreover, the screener.in further provides the latest information like annual reports and credit ratings of a company. To illustrate, the news and information section on the website is presented in the image below.
Related Article – Top Website for Stock Fundamental Analysis
About Us
NTA® is one the leader in providing stock market education to the investor. We provide training to the investors for technical analysis of the stock. Along with the technical analysis, we also provide training to do a fundamental analysis of stocks. In addition, with the help of our training, the investors can become successful intraday traders. Just contact us to become successful in the stock market. You can reach us via e-mail or call us on phone.

